Production Line Sim
In the book The Goal by Eli Goldratt there is a chapter where Alex Rogo takes his son on a hike with his scout troop. As they are hiking Alex begins to see the walking of the boys as a sort of production line.
While the boys are taking a break Alex comes up with a game for the boys to play that functions on a turn system with marbles and bowls
This is the basis for the production line sim.
The Concept
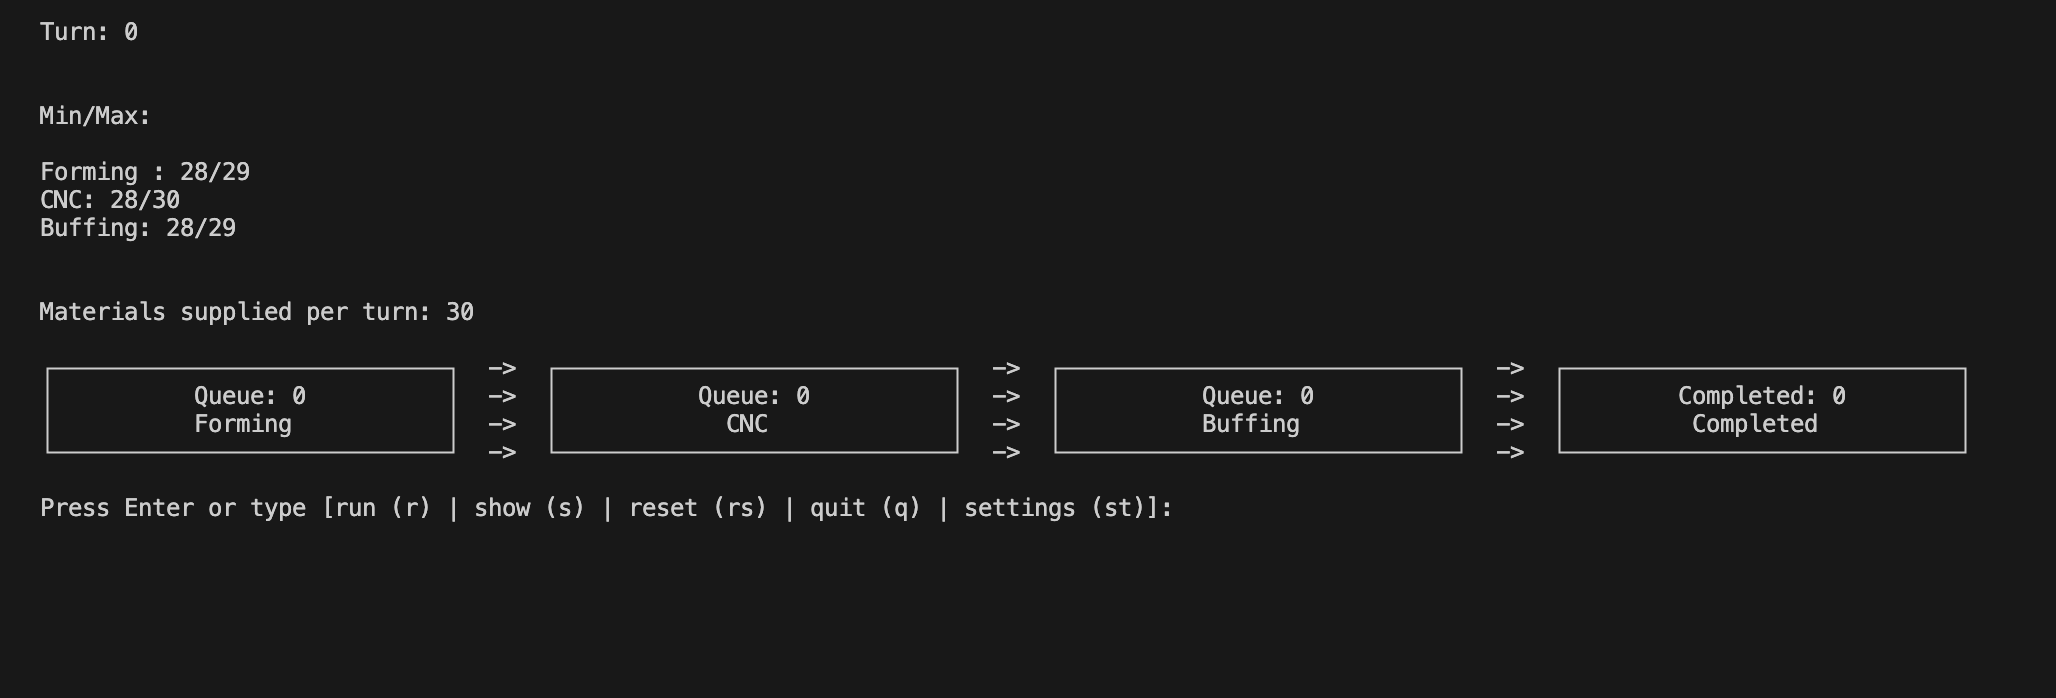
The first version of the production line simulator was made to simulate the marbles and bowls game in the command line. There are 3 “work stations” that can produce a varying amount of product every turn based on the input values. Each turn the work stations produce their amount and move product to the next work station. Any product that is not sent through the work station is held in the queue.
How it Works
There are a few concepts from the book that are displayed in this demo
Identifying Bottlenecks: Bottlenecks can easily be identified in this demo by spotting where the queue starts to pile up
Releasing Material into the system: There is a material release variable that when adjusted can be shown to either overload the system or be the constraint itself
Statistical Fluctuation: Statistical fluctuation can be seen by setting the range of production rates for each work station. In practically every manufacturing practice there is statistical fluctuation and this demo models that.
What This Shows
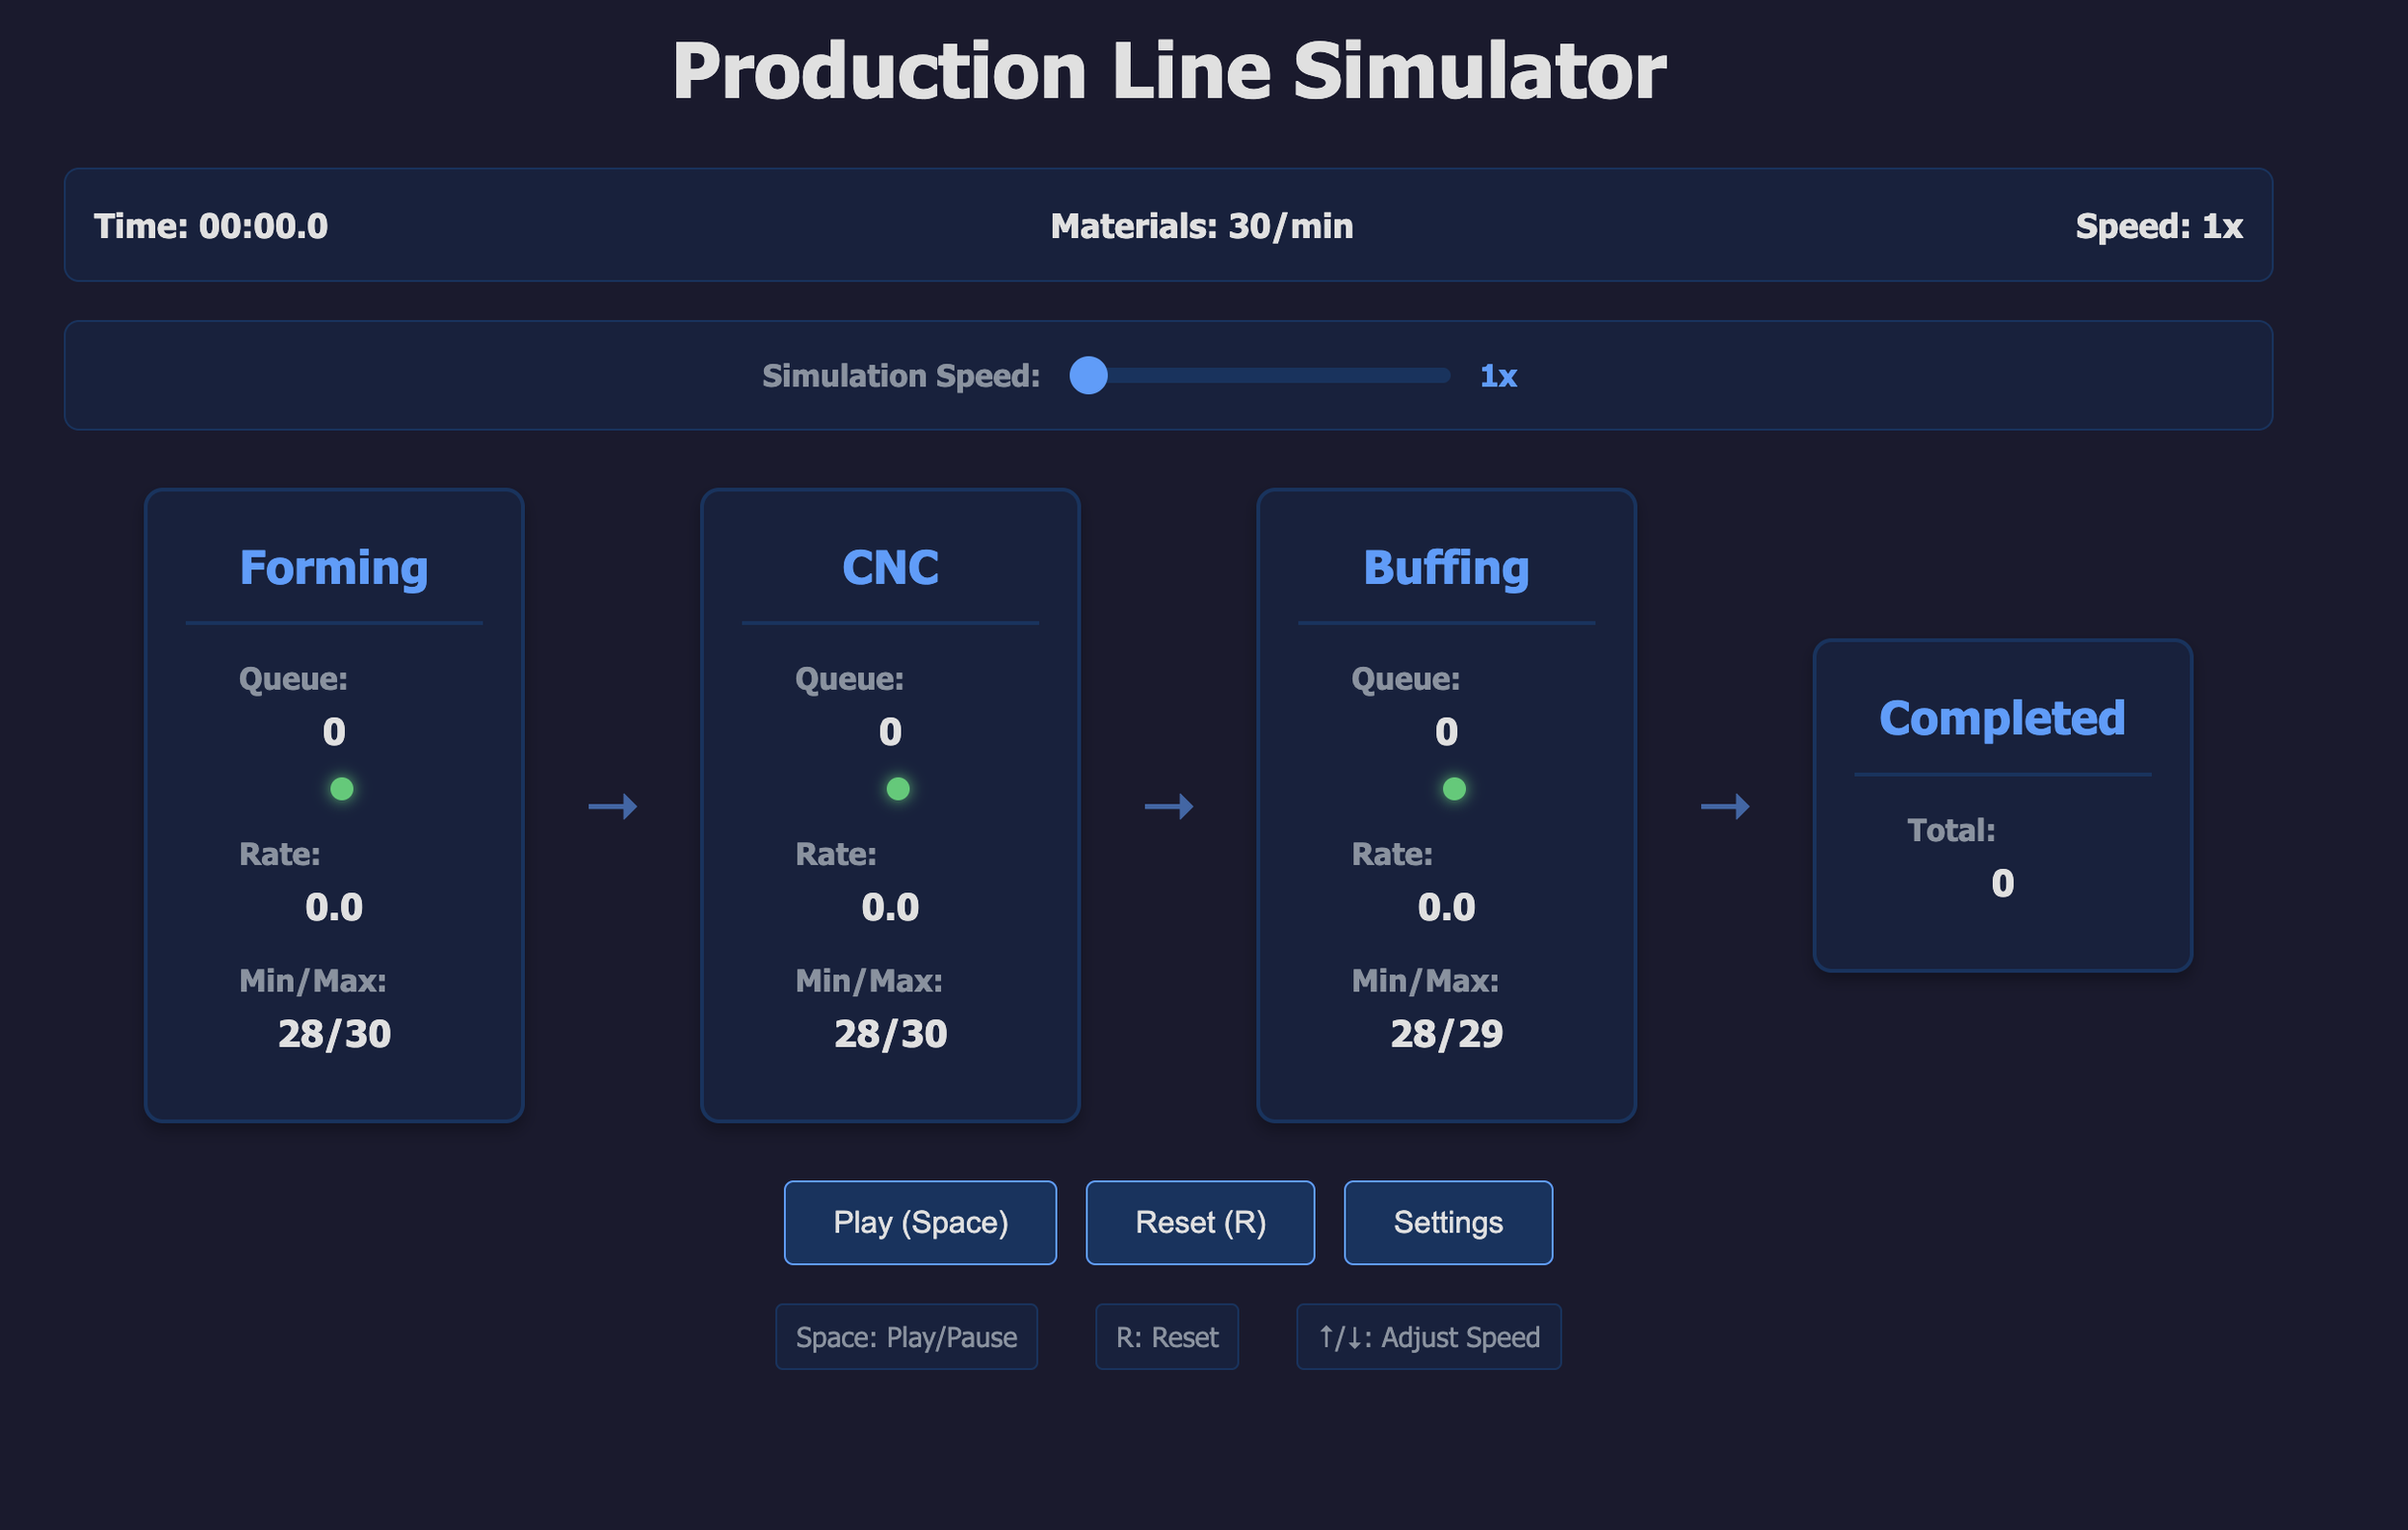
The goal of the second version of the production line simulator was to move from a turn system to a linear time progression where material was moved through the system at a rate of time instead of having to be advanced every turn. Along with this came queue indicators. This function allowed you to be able to see which work stations were becoming bottlenecks.
How it Works
† Disclaimer: the UI and the switch from a turn based system to a time release system was done using AI
There are a few concepts from the book that are displayed in this demo
Identifying Bottlenecks: Bottlenecks can easily be identified in this demo by spotting where the queue starts to pile up
Releasing Material into the system: There is a material release variable that when adjusted can be shown to either overload the system or be the constraint itself
Statistical Fluctuation: Statistical fluctuation can be seen by setting the range of production rates for each work station. In practically every manufacturing practice there is statistical fluctuation and this demo models that.
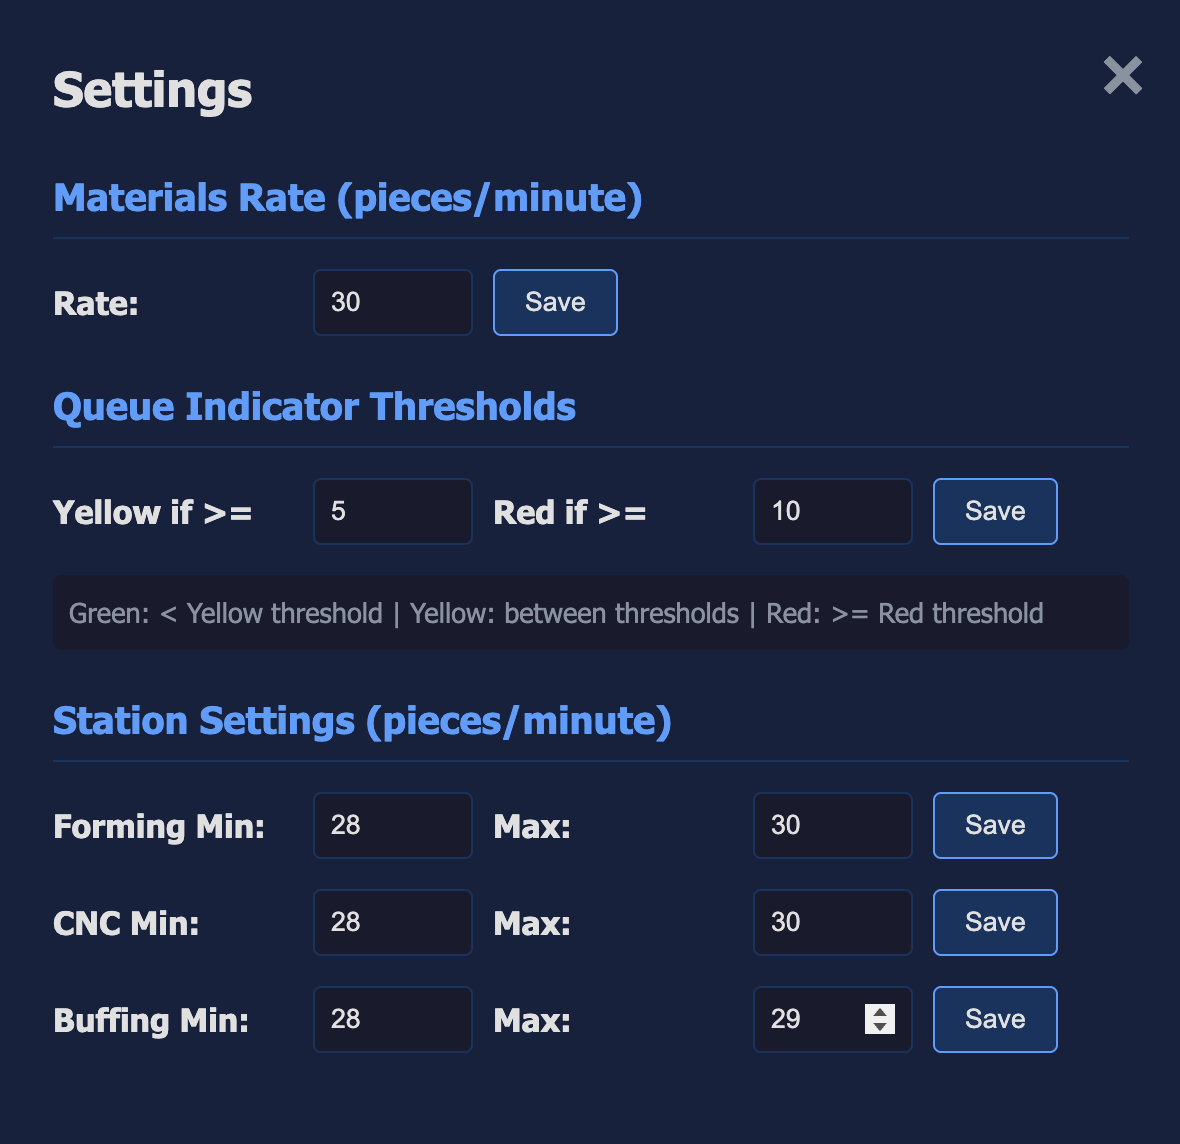
Queue Indicators: Queue Indicators can be adjusted show let you know where a possible bottlenecks could be. It is suggested that they are set according to DBR (Drum, Beat, Rope) In Standing On the Shoulders of Giants by Eli Goldratt